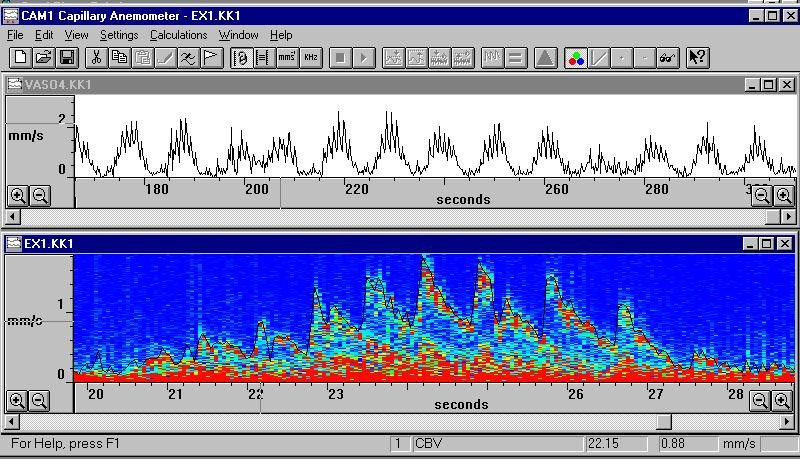
This image shows a screen dump of two data measurements. both traces in the image show measurements of the velocity in a single capillary on the dorsal middle phalangeal area of my finger. The top trace shows a continous measurement over about one minute. The periodic variations of the cardiac cycle (about 1 second period) and vasomotion (about 10 second period) can clearly be seen. The lower trace shows an expanded section with the colour coded raw Doppler shift spectrum to show the narrow Doppler shift obtained.
last updated 10/1/11